# Created using vignettes/zonation.Rmd
# Contains all SDM layers included in Zonation output
load(here("inst/extdata/bowen_sdm_status.rda"))
# Create relative path to read in each SDM
bowen_sdm_status$relpath <- paste0("inst/extdata/sdm/", bowen_sdm_status$filepath)
# Create all species raster stack
sdm_stack <- lapply(bowen_sdm_status$relpath, function(x) {here(x) %>% rast()}) %>% rast()
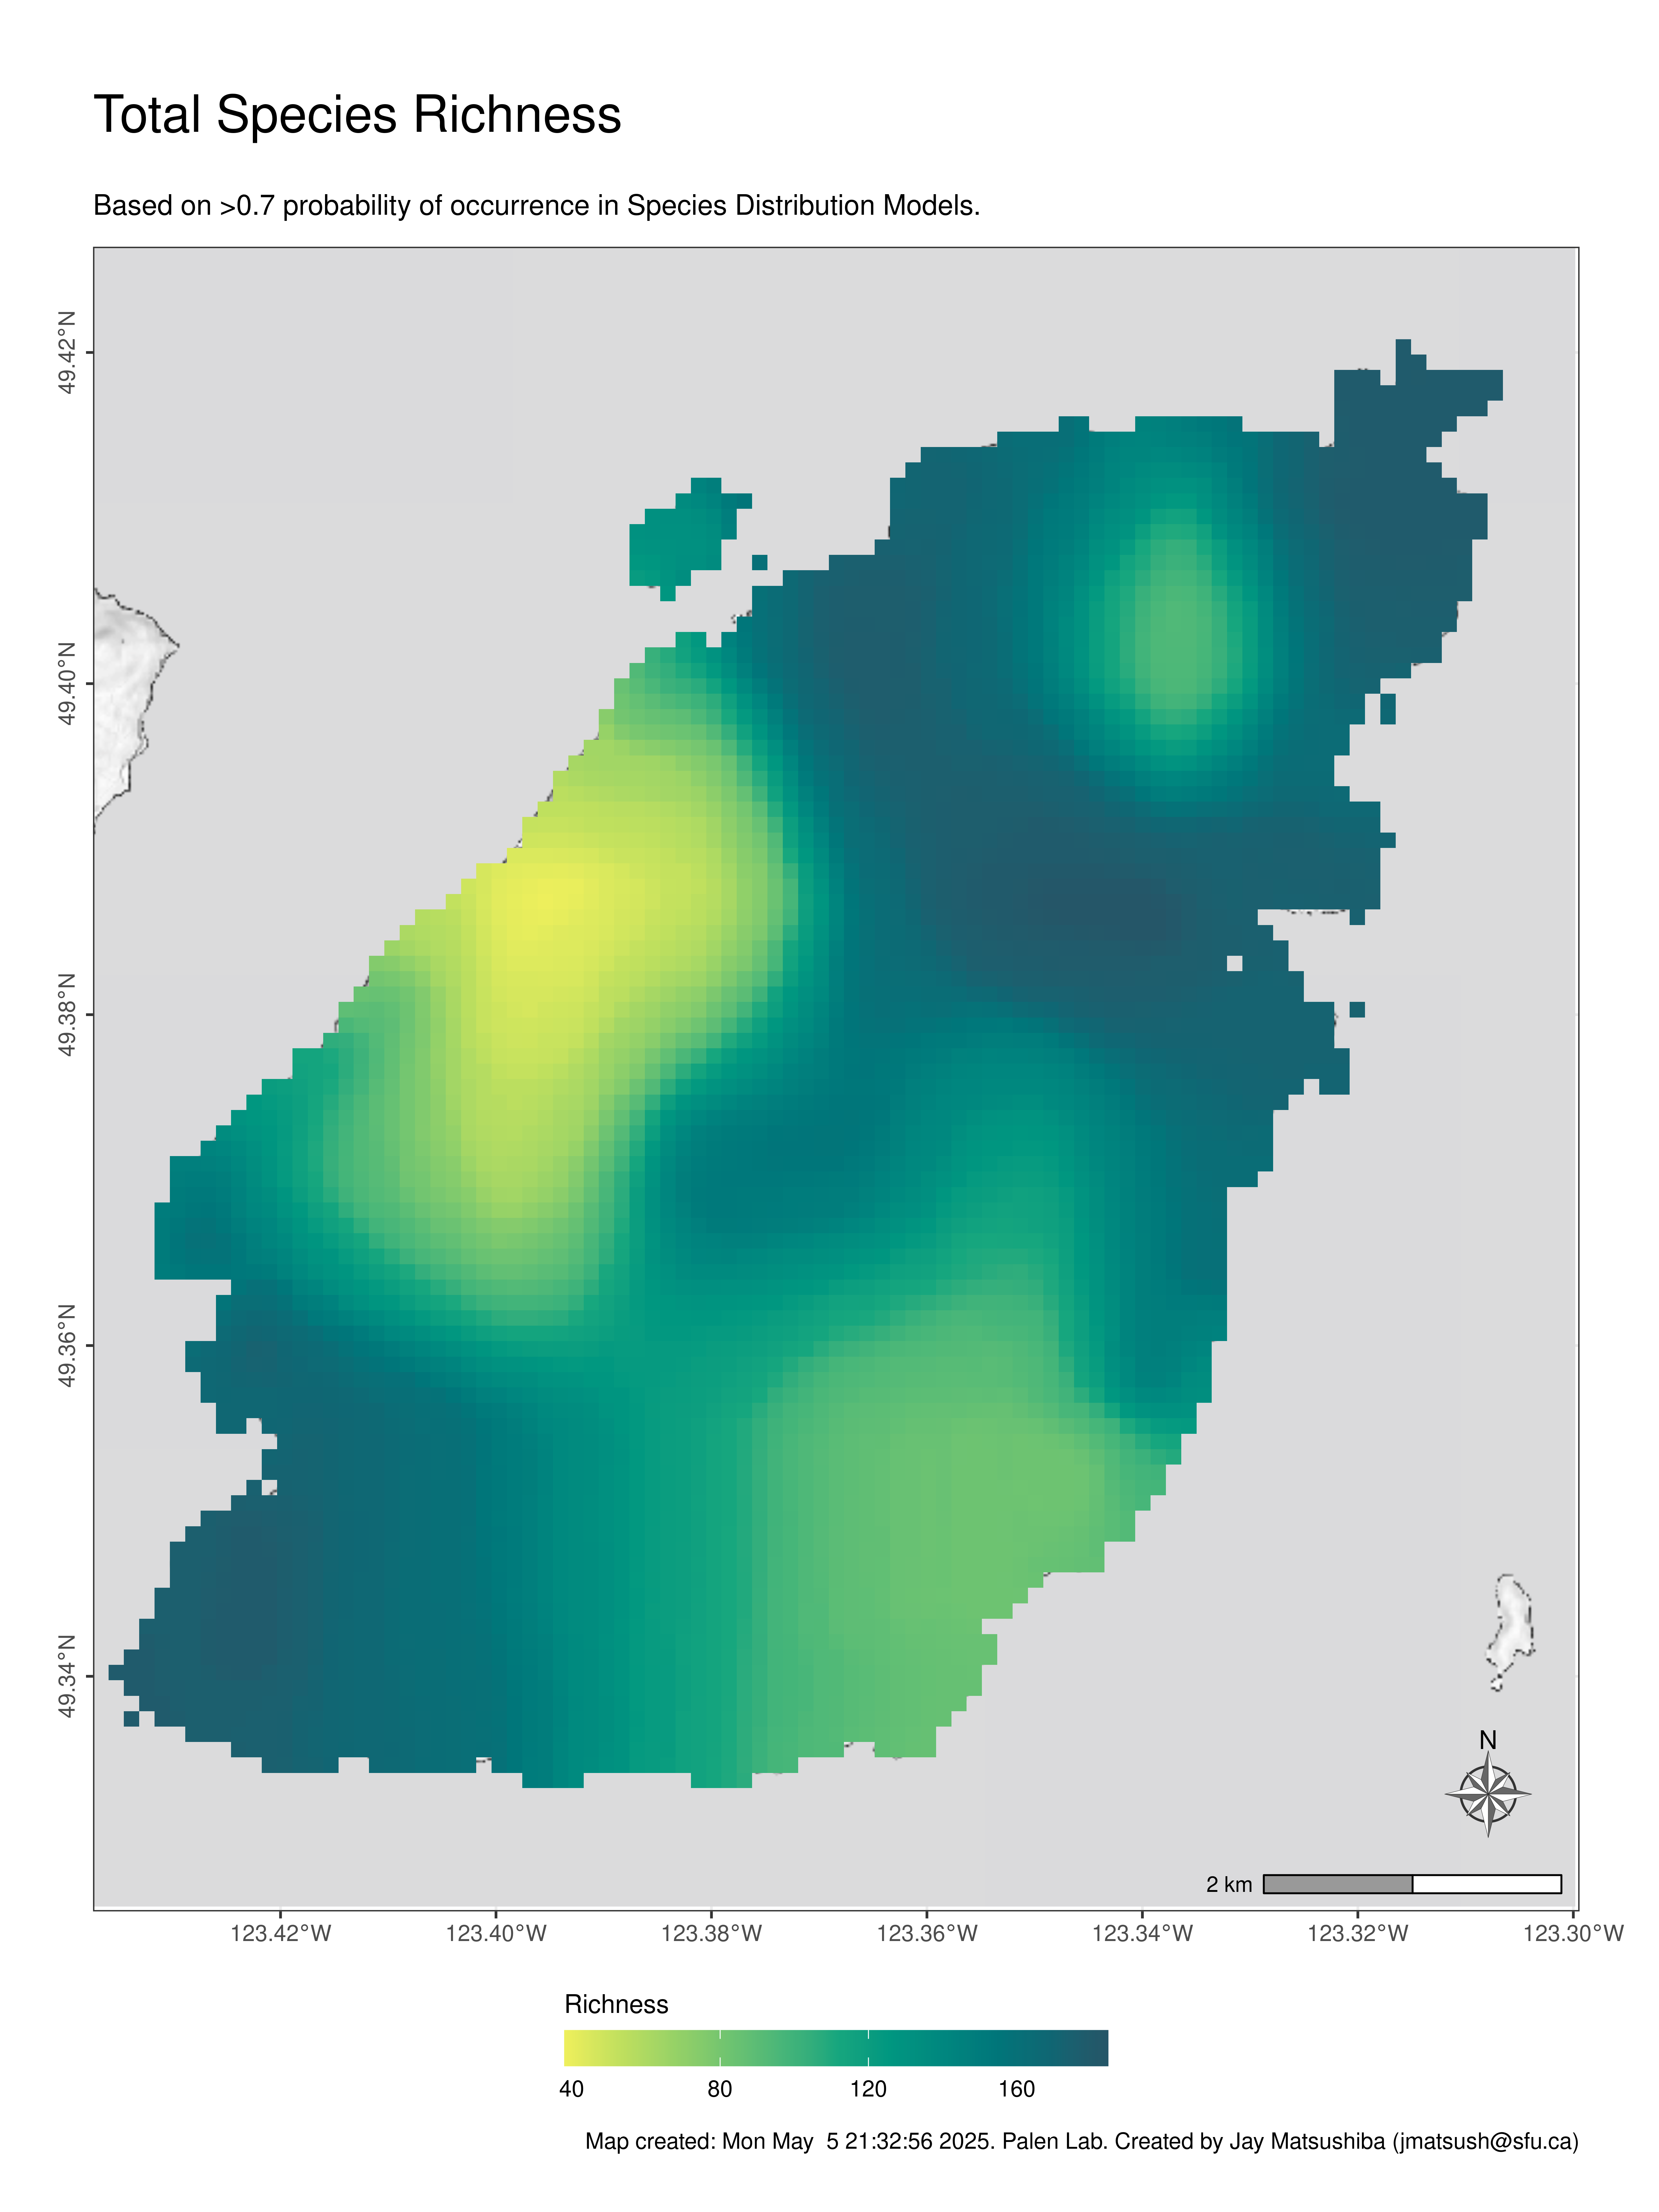
# Create species richness SDM
presence_threshold <- 0.7
total_richness_0.7 <- sdm_to_species_richness(SDM_stack = sdm_stack,
presence_threshold = presence_threshold)
writeRaster(total_richness_0.7, here("inst/extdata/bowen_sdm_richness.tif"), overwrite = T)
# Create species richness plots:
## Each species is marked present in a cell, if they are above a certain
## threshold of probability in the input SDMs.
subtitle <- paste0("Based on >",
presence_threshold,
" probability of occurrence in Species Distribution Models.")
caption <- paste0("Map created: ", date(), ". Palen Lab. Created by Jay Matsushiba (jmatsush@sfu.ca)")
title <- "Total Species Richness"
total_richness_0.7_plot <- bowen_map(raster_layer = total_richness_0.7,
title = title,
subtitle = subtitle,
caption = caption,
legend_label = "Richness")